
Shell and graphic utilities for hardware detection.
I recently had a problem trying to install the NVIDIA driver for my machine. It seemed the latest driver had stopped supporting my graphics card, and after updating my kernel, I was out of a driver. The question, obviously, was “which card did I have?” But, I didn't remember. If you have to name the chipset of your motherboard, specify the CPU in your box or get any other kind of hardware-related information, Linux provides several utilities to help you. In my case, I quickly could get the full ID of my graphics card, confirm that it really was getting a bit long in the tooth and decide that a newer one wasn't such a bad idea.
In this article, I discuss several ways of getting hardware data for your machine. In the most time-honored Linux shell way, I show how to work with several command-line utilities, but if you prefer using a GUI, I also include some graphical programs. And, if you want to get into the nitty-gritty details, I give some pointers on how to get that information by using the /proc or /sys filesystem.
Let's start the command-line work with a set of several utilities, whose names all start with ls (Table 1). Some of these commands provide overlapping information (lsdev or lshw, for instance), but by using all of them, you can get a pretty clear idea of whatever may be inside your Linux box.
Table 1. The ls* family of commands lets you access all aspects of your hardware.
| Command | Description |
|---|---|
| lsblk | Produces information about all block devices, such as hard disks, DVD readers and more. |
| lscpu | Shows information like number of CPUs, cores, threads and more. |
| lsdev | Displays data about all devices of which the system is aware. |
| lshw | Lists general hardware data—gives information on every detail of your hardware. |
| lspci | Displays information about PCI buses in your box and devices connected to them, such as graphics cards, network adapters and more. |
| lsscsi | Provides information on all SCSI devices or hosts attached to your box, such as hard disk drives or optical drives. |
| lsusb | Generates information about USB buses in your box and devices connected to them. |
Let's start with CPU information. The lscpu command provides data on the CPUs in your box. You can opt to include all CPUs, whether off-line or on-line, with the -.all parameter, or you can select --online and --offline. The --parse option lets you choose what CPU characteristics to list, including number, socket, cache data, maximum and minimum speed (in MHz) and more. In my case, you'll see that my machine has a somewhat old single-socket, four-core, Intel Core 2 Quad CPU, at 2.66GHz:
> lscpu
Architecture:        x86_64
CPU op-mode(s):      32-bit, 64-bit
Byte Order:          Little Endian
CPU(s):              4
On-line CPU(s) list: 0-3
Thread(s) per core:  1
Core(s) per socket:  4
Socket(s):           1
NUMA node(s):        1
Vendor ID:           GenuineIntel
CPU family:          6
Model:               23
Model name:          Intel(R) Core(TM)2 Quad CPU Q8400 @ 2.66GHz
Stepping:            10
CPU MHz:             2003.000
CPU max MHz:         2670.0000
CPU min MHz:         2003.0000
BogoMIPS:            5340.67
Virtualization:      VT-x
L1d cache:           32K
L1i cache:           32K
L2 cache:            2048K
NUMA node0 CPU(s):   0-3
(Note: you can get most of this information by examining the /proc/cpuinfo file or by browsing the /sys/bus/cpu/ directories; see the DIY with /proc and /sys sidebar for more on this.)
Let's move on to block devices, such as hard disks, or CD and DVD units. The lsblk command produces information on all available block devices (see Listing 1 for an example). As you can see, I have three hard disks and a ROM (DVD) device. The three disks are known as /dev/sda, /dev/sdb and /dev/sdc; the ROM device is /dev/sr0. The disks are 466GB, 149GB and 2.7TB in size. You can get a little information about partitioning too; for instance, you can see that the first two disks have a swap area enabled, but the third one doesn't. You also can get the mountpoints (/, /disk-laptop and /disk-data) for the three disks.
There are many possible optional arguments, but the most typically used are --paths, which produces full device paths, and --topology, if you are interested in internal details, such as physical sector size, I/O scheduler name and so on. You can get owner, group and permissions information with --perm, as shown below (and, if you really want detailed information, try --output-all, which will list about 50 columns' worth of data):
> lsblk --perm
NAME      SIZE OWNER GROUP MODE
sda     465.8G root  disk  brw-rw----
|__sda1     4G root  disk  brw-rw----
|__sda2 461.8G root  disk  brw-rw----
sdb     149.1G root  disk  brw-rw----
|__sdb1     4G root  disk  brw-rw----
|__sdb2   145G root  disk  brw-rw----
sdc       2.7T root  disk  brw-rw----
|__sdc1   2.7T root  disk  brw-rw----
sr0      1024M root  cdrom brw-rw----
For SCSI devices, you can add --scsi to lsblk, but there's also the more specific lsscsi command. The basic information it produces is shown below, and it includes all available SCSI devices. In my case, it shows the three hard disks and the optical reader I already found with lsblk, plus three card readers. Note that you also get more information on specific brands and models. For example, I have two Western Digital hard drives (WD5000AAKS and WD30EZRX), plus a Maxtor laptop drive (STM316021) and a Sony AD-7200S DVD unit:
> lsscsi
[2:0:0:0] disk   ATA  WDC WD5000AAKS-0 1D05 /dev/sda
[2:0:1:0] disk   ATA  MAXTOR STM316021 D    /dev/sdb
[3:0:0:0] disk   ATA  WDC WD30EZRX-00M 0A80 /dev/sdc
[3:0:1:0] cd/dvd SONY DVD RW AD-7200S  1.61 /dev/sr0
[4:0:0:0] disk   Sony Card_R/W     -CF 1.11 /dev/sdd
[4:0:0:1] disk   Sony Card_R/W     -SD 1.11 /dev/sde
[4:0:0:2] disk   Sony Card_R/W     -MS 1.11 /dev/sdf
Check out all the possibilities of this command with lsscsi --help. You'll see that you really can dig down into SCSI devices with it. And, if you're interested, this command works by scanning the /sys filesystem (see Resources, and the DIY with /proc and /sys sidebar for more information).
Now, let's move on to some other commands. lsusb provides information on all USB-connected devices; see Listing 2 for an example. (An alternative is usb-devices, but it's somewhat more obscure in its output and has no configuration options.) As in most modern computers, you'll probably have a lot of such devices. In my case, I have a Bluetooth dongle, Webcam, keyboard, mouse and more. You can get information on a specific bus or device with the -s option or select a given vendor with the -d option; for the latter, check the USB ID repository (see Resources) for vendor/device numbers. Finally, if you want very detailed information, try the -v (verbose) option, but be prepared to read a lot. For my machine, lsusb -v produces more than 1,300 lines of output.
Another command that can produce a ton of information is lspci, which shows all data on PCI devices. And, as a matter of fact, this is the actual command I used to remember what kind of graphics card I had:
# lspci
00:00.0 Host bridge: Intel Corporation 4 Series
 ↪Chipset DRAM Controller (rev 03)
00:01.0 PCI bridge: Intel Corporation 4 Series
 ↪Chipset PCI Express Root Port (rev 03)
00:1b.0 Audio device: Intel Corporation NM10/ICH7
 ↪Family High Definition Audio Controller (rev 01)
00:1c.0 PCI bridge: Intel Corporation NM10/ICH7
 ↪Family PCI Express Port 1 (rev 01)
00:1c.1 PCI bridge: Intel Corporation NM10/ICH7
 ↪Family PCI Express Port 2 (rev 01)
00:1d.0 USB controller: Intel Corporation NM10/ICH7
 ↪Family USB UHCI Controller #1 (rev 01)
00:1d.1 USB controller: Intel Corporation NM10/ICH7
 ↪Family USB UHCI Controller #2 (rev 01)
00:1d.2 USB controller: Intel Corporation NM10/ICH7
 ↪Family USB UHCI Controller #3 (rev 01)
00:1d.3 USB controller: Intel Corporation NM10/ICH7
 ↪Family USB UHCI Controller #4 (rev 01)
00:1d.7 USB controller: Intel Corporation NM10/ICH7
 ↪Family USB2 EHCI Controller (rev 01)
00:1e.0 PCI bridge: Intel Corporation 82801 PCI
 ↪Bridge (rev e1)
00:1f.0 ISA bridge: Intel Corporation 82801GB/GR
 ↪(ICH7 Family) LPC Interface Bridge (rev 01)
00:1f.1 IDE interface: Intel Corporation 82801G (ICH7
 ↪Family) IDE Controller (rev 01)
00:1f.2 IDE interface: Intel Corporation NM10/ICH7
 ↪Family SATA Controller [IDE mode] (rev 01)
00:1f.3 SMBus: Intel Corporation NM10/ICH7 Family
 ↪SMBus Controller (rev 01)
01:00.0 Ethernet controller: Qualcomm Atheros AR8152
 ↪v2.0 Fast Ethernet (rev c1)
04:00.0 VGA compatible controller: NVIDIA Corporation
 ↪GK107 [GeForce GT 740] (rev a1)
04:00.1 Audio device: NVIDIA Corporation GK107 HDMI
 ↪Audio Controller (rev a1)
Try the -v or -vv options, for verbose and very verbose listings. To get full information on my (current) graphics card, I proceeded as shown in Listing 3. I now have an NVIDIA GeForce 740, and I'm using the nouveau kernel driver, among other internal details. Of course, to understand the produced information fully, you must have a bit of experience with PCI devices. Try the same command with -vv, and you'll see what I'm talking about.
If you are even more electronically/digitally minded, lsdev produces information about your installed hardware, including interrupts, ports, addresses and all such internal details. This command provides no options, and it's not likely you'll use it unless you are dealing very closely with hardware. Listing 4 shows an abbreviated example of the output. This command scans /proc/interrupts, /proc/ioports and /proc/dma, as described in the DIY with /proc and /sys sidebar.
Finally, if you've made it this far, the lshw command is a sort of catch-all that can produce lots of information on all of your installed hardware. The -short option provides a (somewhat) abbreviated listing of everything in your box (see Listing 5, and note some interesting lines, “To Be Filled By O.E.M.”, which show that someone was careless when setting up my motherboard). With this command, you get information on the system, buses, memory, processor, display, network and everything else.
Notice the “class” column in Listing 5. You can get a hint of the full information that lshw can provide by using the -class parameter to limit output. For example, see below the detailed specs on my network card; it shows the vendor, model and plenty of other details (warning: this is the kind of output you get if you don't restrict the command with -short; for my machine, lshw with no extra options produces a listing more than 500 lines long):
# lshw -class network
  *-network
    description: Ethernet interface
    product: AR8152 v2.0 Fast Ethernet
    vendor: Qualcomm Atheros
    physical id: 0
    bus info: pci@0000:01:00.0
    logical name: eth0
    version: c1
    serial: bc:5f:f4:12:e0:f1
    size: 100Mbit/s
    capacity: 100Mbit/s
    width: 64 bits
    clock: 33MHz
    capabilities: pm msi pciexpress vpd bus_master
 ↪cap_list ethernet physical tp 10bt 10bt-fd
 ↪100bt 100bt-fd autonegotiation
    configuration: autonegotiation=on broadcast=yes
 ↪driver=atl1c driverversion=1.0.1.1-NAPI
 ↪duplex=full latency=0 link=yes multicast=yes
 ↪port=twisted pair speed=100Mbit/s
    resources: irq:29 memory:fcfc0000-fcffffff
 ↪ioport:dc00(size=128)
The lshw command has several other interesting options. For example, it can produce either HTML or XML output (add the -html or -xml options); the former is appropriate for showing in a browser, while the latter is useful if you want to store or process your hardware information. See Figure 1 for just a small part of the full hardware description of my box. For security purposes, the -sanitize option removes sensitive information, such as serial numbers. There's even an -X option to use a graphical interface (I'll get to that later).
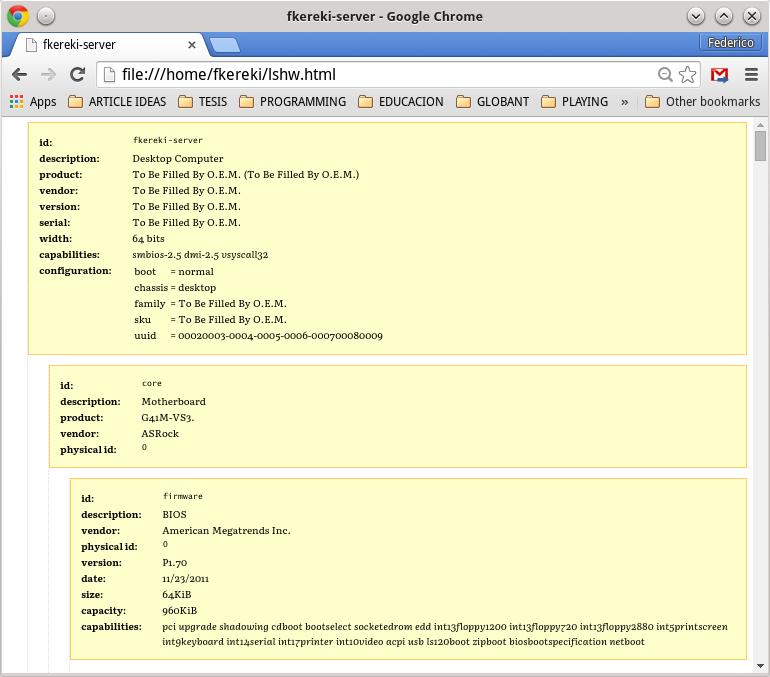
Figure 1. The lshw command also can produce HTML or XML output; the former is shown here.
So far, I've discussed several ls* commands, and even if they are not actually a “family”, they are my favorite tools. It's easy to remember them by typing ls and letting type-ahead suggest the rest. However, there are more command-line possibilities, so let's take a look.
Let's start with some general commands. The first, dmidecode, allows you to dump the computer's DMI (or SMBIOS; see the What's SMBIOS? sidebar) in a more readable format. If the table is found, its contents are dumped record by record, similar to this:
# dmidecode -t 6
# dmidecode 2.12
SMBIOS 2.5 present.

Handle 0x0009, DMI type 6, 12 bytes
Memory Module Information
   Socket Designation: DIMM0
   Bank Connections: 0 1
   Current Speed: Unknown
   Type: DIMM SDRAM
   Installed Size: 4096 MB (Double-bank Connection)
   Enabled Size: 4096 MB (Double-bank Connection)
   Error Status: OK

Handle 0x000A, DMI type 6, 12 bytes
Memory Module Information
   Socket Designation: DIMM1
   Bank Connections: 4 5
   Current Speed: Unknown
   Type: DIMM SDRAM
   Installed Size: Not Installed
   Enabled Size: Not Installed
   Error Status: OK
If you don't want to list the entire table (several hundred lines in my computer), you can restrict the output to a specific type of entry, according to SMBIOS definitions (Table 2).
Table 2. SMBIOS has several record types that you can select with dmidecode.
| Type | Description |
|---|---|
| 0 | BIOS |
| 1 | System |
| 2 | Baseboard |
| 3 | Chassis |
| 4 | Processor |
| 5 | Memory Controller |
| 6 | Memory Module |
| 7 | Cache |
| 8 | Port Connector |
| 9 | System Slots |
| 10 | On-board Devices |
| 11 | OEM Strings |
| 12 | System Configuration Options |
| 13 | BIOS Language |
| 14 | Group Associations |
| 15 | System Event Log |
| 16 | Physical Memory Array |
| 17 | Memory Device |
| 18 | 32-bit Memory Error |
| 19 | Memory Array Mapped Address |
| 20 | Memory Device Mapped Address |
| 21 | Built-in Pointing Device |
| 22 | Portable Battery |
| 23 | System Reset |
| 24 | Hardware Security |
| 25 | System Power Controls |
| 26 | Voltage Probe |
| 27 | Cooling Device |
| 28 | Temperature Probe |
| 29 | Electrical Current Probe |
| 30 | Out-of-band Remote Access |
| 31 | Boot Integrity Services |
| 32 | System Boot |
| 33 | 64-bit Memory Error |
| 34 | Management Device |
| 35 | Management Device Component |
| 36 | Management Device Threshold Data |
| 37 | Memory Channel |
| 38 | IPMI Device |
| 39 | Power Supply |
| 40 | Additional Information |
| 41 | Onboard Devices Extended Information |
| 42 | Management Controller Host Interface |
| 126 | Disabled Entry |
| 127 | “End-of-Table” Special Marker |
| 128–255 | OEM-specific Data |
You also can use specific keywords to restrict the output to a few types (Table 3).
Table 3. You also can use special keywords to get related information from SMBIOS.
| SMBIOS Keyword | SMBIOS Types |
|---|---|
| bios | 0,13 |
| system | 1,12,15,23,32 |
| baseboard | 2,10,41 |
| chassis | 3 |
| processor | 4 |
| memory | 5,6,16,17 |
| cache | 7 |
| connector | 8 |
| slot | 9 |
If I were to give an award for “Most Talkative Command”, surely it would go to hwinfo, another command that can dump all the hardware information on your computer. On my machine, running hwinfo without any parameters produces more than 12,000 lines, including several memory dumps of the SMBIOS table. You can produce a much more compact version with the --short option (Listing 6).
You can restrict hwinfo to a specific type of hardware by adding an option, such as --monitor or --printer. Get the whole list of options with hwinfo --help. For instance, I can dump the optical unit data with hwinfo --cdrom (Listing 7). The --listmd option lets you include RAID devices, which usually aren't included in the standard output.
Of the command-line programs I'm covering in this article, inxi is more colorful, even if only moderately (Figure 2).
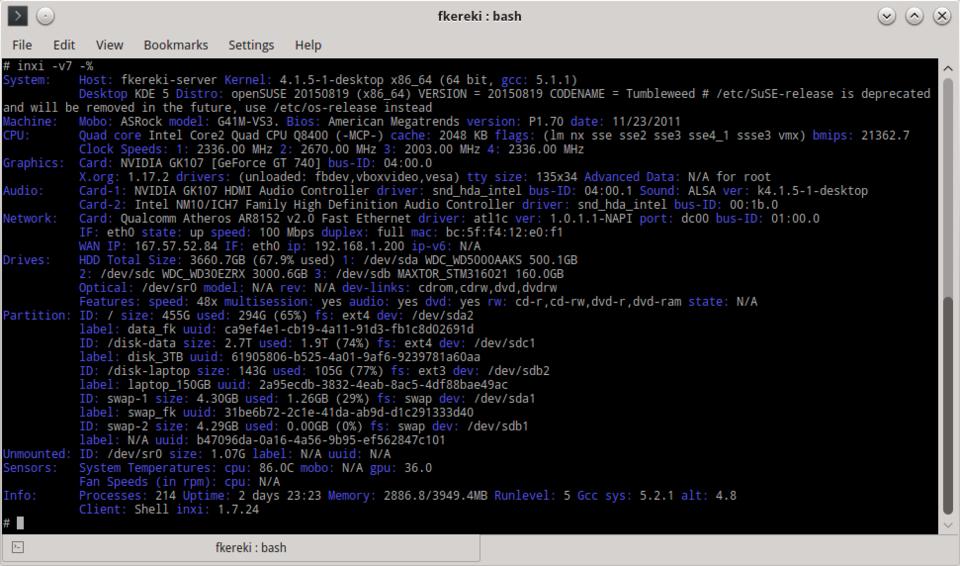
Figure 2. inxi, even if only a command-line tool, at least tries to use some colors.
If invoked with no parameters, it will just produce a line like the following, showing CPU, kernel, uptime and a few more details:
CPU~Quad core Intel Core2 Quad CPU Q8400 (-MCP-)
 ↪clocked at 2003.000 Mhz Kernel~4.1.5-1-desktop
 ↪x86_64 Up~2 days 23:24 Mem~2377.4/3949.4MB
 ↪HDD~3660.7GB(67.9% used) Procs~202 Client~Shell
 ↪inxi~1.7.24
However, you can use lots of options to get specific data. For example, you can set the verbosity level with options -v0 (minimum) through -v7 (maximum verbosity). The -x option allows including extra information for some hardware. Check out inxi -h to get all possible options. For instance, you can get audio information with inxi -A or graphics card data with inxi -G and so on:
# inxi -A
Audio:     Card-1: NVIDIA GK107 HDMI Audio Controller
 ↪driver: snd_hda_intel Sound: ALSA ver: k4.1.5-1-desktop
           Card-2: Intel NM10/ICH7 Family High
 ↪Definition Audio Controller driver: snd_hda_intel
Now, let's finish with some GUI options.
To start with, usbview is a rough graphic equivalent of lsusb or usb-devices, which I discussed earlier. It's quite simple to use, with no options or parameters. It shows two columns: the left one is a tree of all available USB devices, and the right one gives the full details. Figure 3 shows details on my USB keyboard.
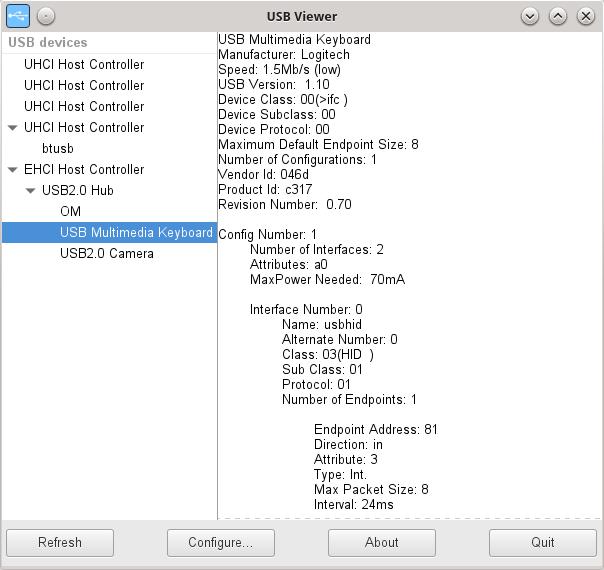
Figure 3. The usbview command shows the details of all USB devices in tree form.
Let's move on to a command I already discussed, which shares the display style: lshw -X. Instead of producing a listing (as shown previously), the -X option produces a graphic interface with several columns on the left to let you choose what hardware to inspect. An area to the right shows the full hardware details for the chosen device. Figure 4 shows the result of analyzing my optical DVD reader/writer unit; the provided information includes other details, such as the logical unit name, its capabilities and more.
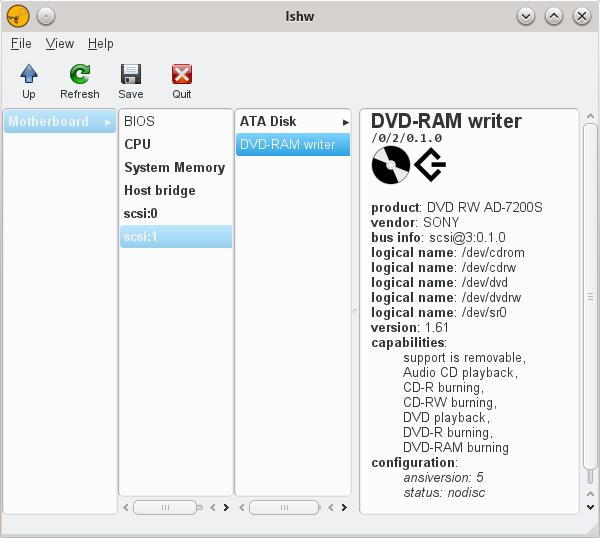
Figure 4. The lswh -X command produces a graphic interface that lets you browse all hardware devices.
Another interesting program is hardinfo, which “is not dead, but needs a maintainer”, according to its GitHub page (see Resources.) This program shows a tree structure to the left with four main branches:
Computer shows lots of details about your machine: some are related to software and not to hardware.
Devices includes all devices in your box, grouped by category.
Network not only shows network card details, but also some other aspects, such as DNS servers or routing.
Benchmarks lets you see how your machine fares against other computers, but because of the lack of updates, the comparisons are against old CPUs.
Figure 5 shows sample output.
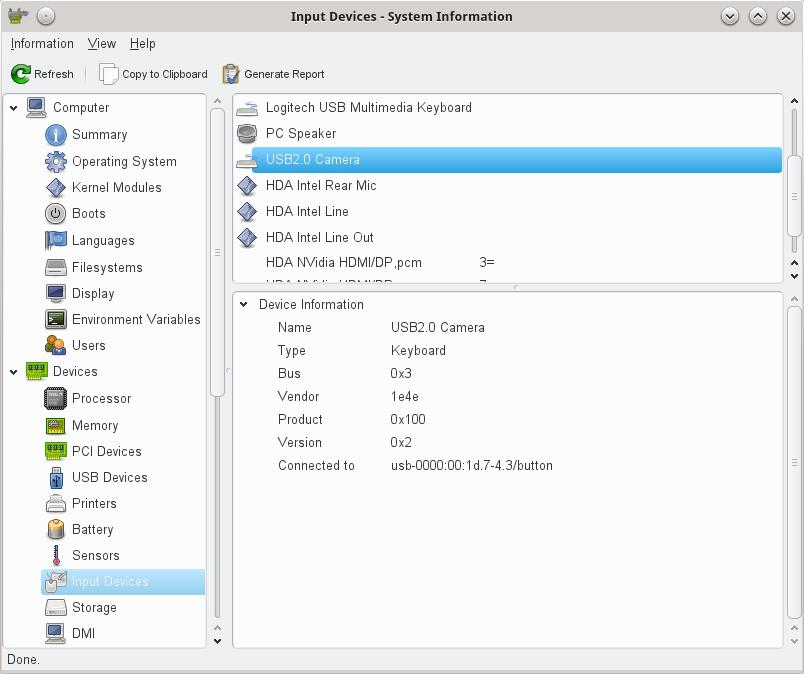
Figure 5. The hardinfo command includes several extra pieces of data, not limited only to hardware.
There are two more options. The “Information” menu entry allows you to produce a report, in either HTML or plain-text format, choosing whichever parts interest you. The “Network Updater” should let you update the internal program data, including more recent benchmark results, but when I tried to run it, I got a “Contacting HardInfo Central Database (failed)” message. See Figure 6 for a example of the produced HTML report.
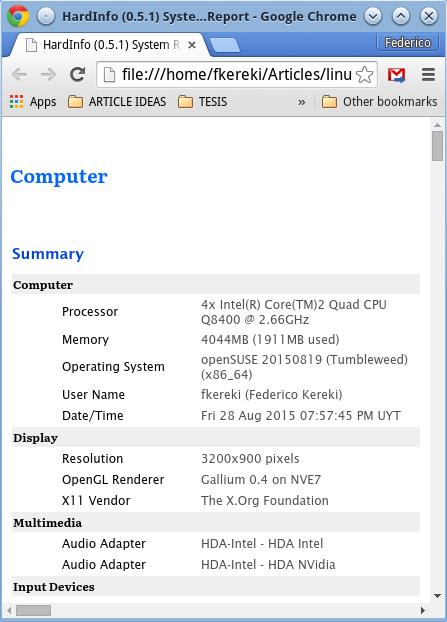
Figure 6. The hardinfo command can produce an HTML or text report describing your complete system.
Let's end with KDE's own kinfocenter. This utility (see Figure 7, which shows RAM details for my machine) is similar to the previous tools I've been describing, and it offers a left pane with a tree with all available options and a right pane with more details on the chosen option at the left.
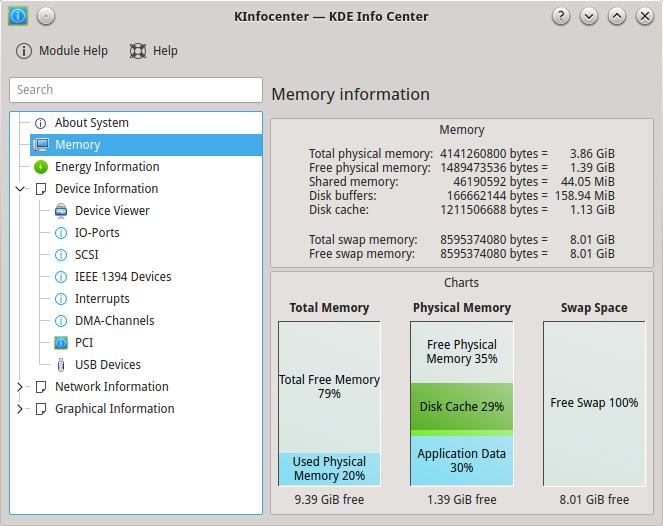
Figure 7. KDE's own kinfocenter shows not only hardware details, but plenty of other system data as well.
The program doesn't restrict itself to hardware details, but shows all kinds of other information, such as “Samba Status”, “Energy Information” or “X-Server”, just to mention a few.
I've covered a lot of commands that let you query your Linux machine and learn, in more or less detail, what's exactly in it. And if you need to, you even can get at the base data by yourself and whip up your own hardware-inspection tool.
